Crypto Bull Market-ARE YOU READY TO RUN WITH THE BULLS?
The crypto bull market has been pretty light on the news this week which gives us a chance to reflect on the last bull run in 2017. Make sure you take time to consider your personal goals and profit points for the next run and try not to get distracted by the hype and run up that is inevitably stampeding forth.
Using the daily candles from 2017, you might be able to use these movements to help foreshadow future trends – although there’ll always be discrepancies.
I followed the thought process that the BTC run from $1,750 USD to the all-time high of $20,000 USD could follow a similar pattern if (and when) it moves above $20,000 USD. Once the overhead supply is removed, the upside will be significant. I think the possible extent of the next run could take everyone by surprise. I’ll be playing by the rules and will set targets where I’m prepared to take profit without risk of being caught in the moment and getting greedy. If you do take profit too early, don’t be afraid to re-enter on good technicals. Some of us have been waiting a long time for this, and if that’s you, make sure you capitalise.
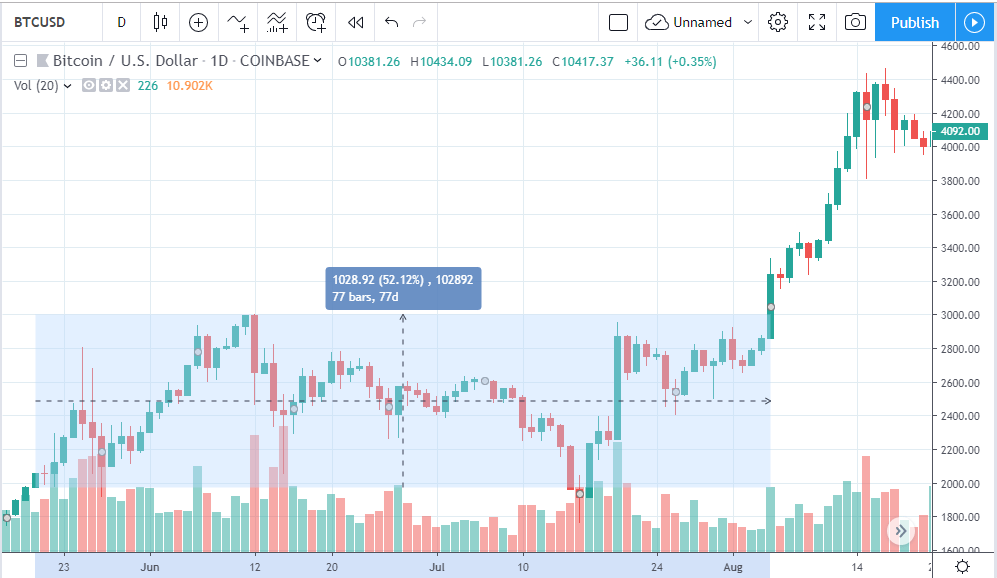
The under $3K USD bracket
This was before we really broke into the upside. From 21st May to 4th August 2017 Bitcoin stayed in the $1,750 – $3,000 bracket and offered a 50% increase at least twice in that time.
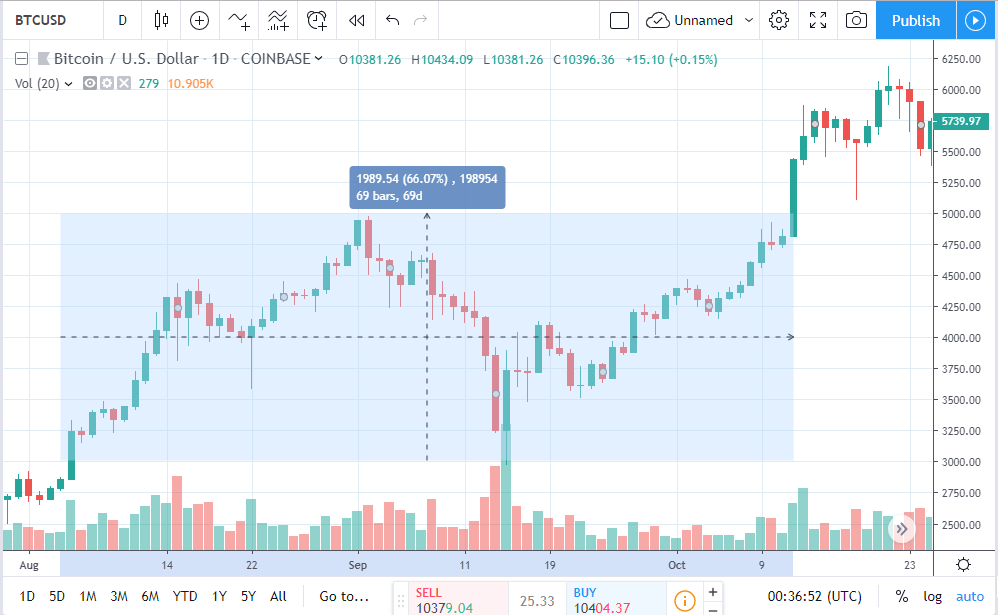
The up to $5K USD bracket
From 5th August to 12th October 2017 Bitcoin broke past $3,000 and spent 69 days in a range up to $5,000 representing a 66% increase. Very large volume appears in the middle of this bracket when Bitcoin perfectly back-tested the previous support of $3,000.
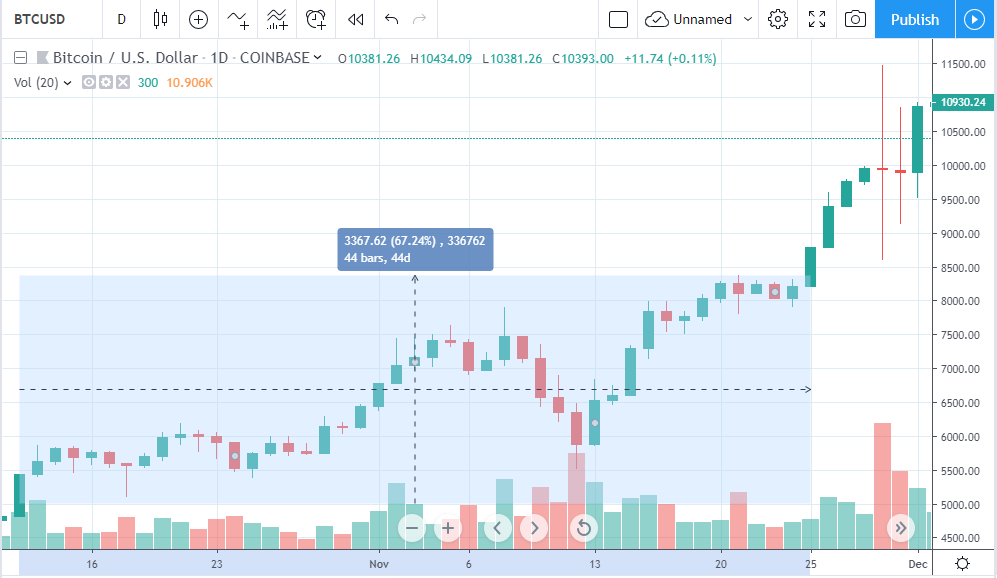
The up to $8.5K USD bracket
The period $5,000 – $8,500 lasted 44 days between 12th October and 25th November 2017. During this period, 67% price appreciation was presented and you could have traded successfully in this range at least twice.
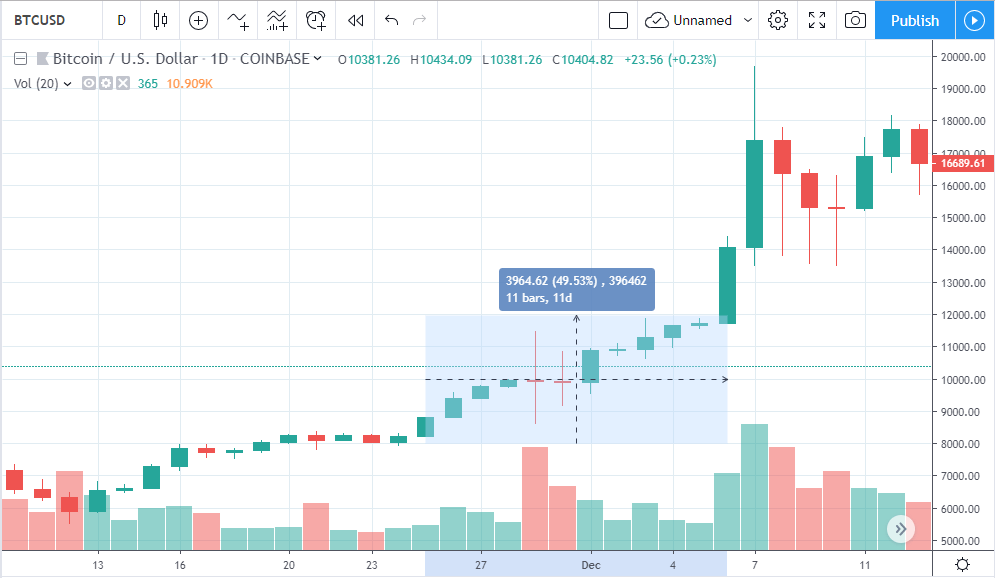
The up to $12K bracket
The period between 25th November and 6th December 2017 presented a 50% increase in price and ranged between $8,000 – $12,000. This represented a fairly aggressive appreciation period, especially when you consider it was only 11 days.
The all time high $20K bracket
Between 6th December and 17th December 2017, Bitcoin went from $12,000 to $20,000, appreciating the last $8,000 of that in just three days. This leap demonstrates a 65% increase in price and stayed there for 11 days before beginning its descent.
Summary
If we breakdown the 2017 run by pure numbers, it really was a ridiculously impressive period. There was a heap of hype and stacks of swing trading opportunities. Using these levels, I’ve replicated a potential target for the next run. The general idea is that once the run starts, you want to avoid getting caught up in the moment. You should have set exits and, if you are seasoned, re-entry points.
One way forward would be to use the below stages to sell or trade 50% of your Bitcoin position, or another might be using these as potential partial take-profit levels.
The final level is $200K USD, which at first glace might seem totally insane, which is fair enough and it just might be. But looking at the previous price movement, and the total lack of history for what’s achievable in this next run, the last run gave us massive appreciations in the final three days. If you are going to hold or trade for this entire period you really want to try and capitalise on that last aggressive price appreciation.
Personally, I’ll have a set level within the below targets where I’ll take out about 30% of my position to cover entries. And then I’ll be looking to hold the residual through to what looks to be the end of the run.
Whatever your targets are, write them down, work on them and keep honest by reminding yourself of what they are. Easier said than done, but try and back your own decisions and avoid getting caught up in too much market noise. You really only want to be able to blame yourself.
All that in mind, let me be explicitly clear – this is not financial advice and you should always do your own research.
|
2017 Bull Run |
Upcoming Bull Run |
||||||
| Days | Start | Finish | % Gain | Days | Start | Finish | |
| 77 | $1,750 | $3,000 | 50% | 80 | $20,000 | $30,000 | |
| 69 | $3,000 | $5,000 | 66% | 70 | $30,000 | $49,800 | |
| 44 | $5,000 | $8,500 | 67% | 45 | $49,800 | $83,166 | |
| 11 | $8,500 | $12,000 | 50% | 15 | $83,166 | $124,749 | |
| 3 | $12,000 | $20,000 | 65% | 5 | $124,749 | $205,835 | |
FEAR & GREED
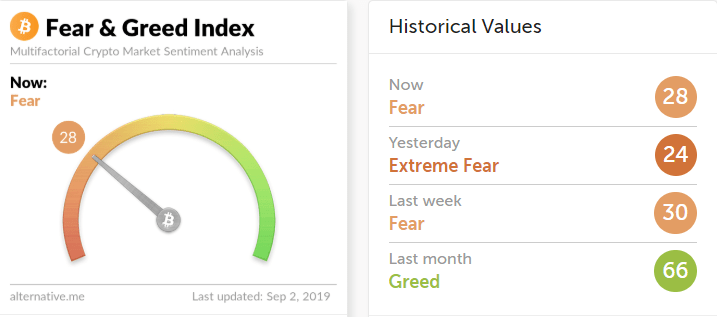
Alternative.me Fear and Greed index continues to be pretty neutral in its readings. The market remains fearful, there are small spikes both ways, but overall, it’s in a sideways range. Don’t be surprised if what appears to be a breakout is in fact a trap and is actually heading backwards. Just today we saw a $700 jump in Bitcoin and it could lead you to invest heavily into a new long position. Be patient and ensure you’re happy with your entry. Take it up when the market is flat and depressed and not reactively on quick, large spikes that generally drift back to support levels – which are $10.1K, $9.7K and $9K at present, all of which are good levels to average back into the market.
TECHNICAL ANALYSIS
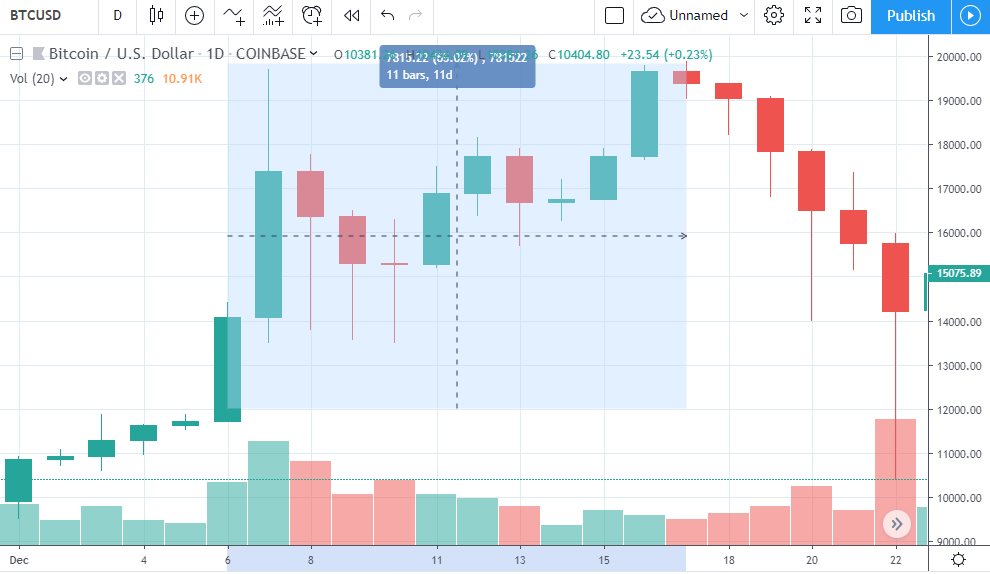
BTC has broken above the 10k USD mark, re entered the triangle pattern, broken the first key Fibonacci resistance and broken the 50MA line! These are all major areas of support for BTC.
It will be interesting to see if BTC now looks to push to the next key Fibonacci resistance at $10900 USD. A break of $10900 USD could have many traders left to dry who were hoping to pick up BTC sub 9k.
This next week should set the precedence for a continuation of a bull run or a major correction.
Conclusion:
As we anticipate the next crypto bull run, reflecting on the 2017 market trends can provide valuable insights for Bitcoin miners and investors alike. The upcoming market movement promises significant opportunities, but staying disciplined with set profit targets is crucial to avoid getting swept up in the hype. Whether you’re new to crypto mining or a seasoned investor, understanding how to mine Bitcoin effectively and using tools like a bitcoin mining calculator can help maximize your returns during this period.
Bitcoin mining remains a cornerstone of the cryptocurrency ecosystem, with bitcoin miners continuously seeking efficient ways to enhance their operations. The anticipated bull market could present lucrative chances for those equipped with the right strategies and mining equipment. Learning how to mine Bitcoin efficiently and staying updated with the latest in BTC mining machines will be essential for capitalizing on these market movements.
For those looking to delve deeper into crypto mining, expert guidance can be invaluable.
Mining Store offers a 30-minute free consultation to help you optimize your mining setup and strategies. Reserve your slot today to gain insights from industry experts and ensure your mining bitcoin endeavors are both profitable and efficient.
Author: Julian Carruthers
Not financial or investment advice, always do your own research.