Bitcoin ATH and the ETF Influence: Unpacking BTC’s Record Surge
Bitcoin Fundamental & Technical Update
What a ride the past couple of weeks has been with a fairly smooth transition of Bitcoin ATH from $40,000 USD to all-time highs this morning at $66,600 USD (BTC is 666 weeks and 6 days old today), strange coincidence…
The question now is where next for the cryptocurrency.
Fundamentally, the price of Bitcoin ATH is being driven largely by the positive market sentiment around the Bitcoin ETF. The Proshares Bitcoin Strategy ETF (BITO), which launched on the NY stock exchange, had a near-perfect debut as it has seen $1.2 billion in turnover on its second trading day. This is the quickest an ETF has reached the $1 billion landmark. It was the second busiest ETF debut on record. Furthermore, there are more ETF’s in the pipeline as VanEck and Valkyrie are potentially coming to the market.
An ETF opens the doors to a whole different group of investors, from institutional to an older generation of investors who may not have been tech-savvy or nervous to purchase the asset individually. Emotions are high at the moment as expected with BTC trading at record highs, from an investment perspective, everyone who has purchased BTC in the past is now in profit.
Taking a look at BTC from a mining point of view, the networked difficulty reset stagnated in its recent update which is great news for us miners. The rewards in BTC terms have remained similar whilst the USD rewards have increased exponentially! The BitOoda North American Hash Spread gained 14.1% from $343 to $391 (as of the 18th of October), so it will most likely be north of $400. The hash spread is the difference between the cost of power and the mining revenue per MWH.
Let’s take a look at some technicals
BTC Heat Map
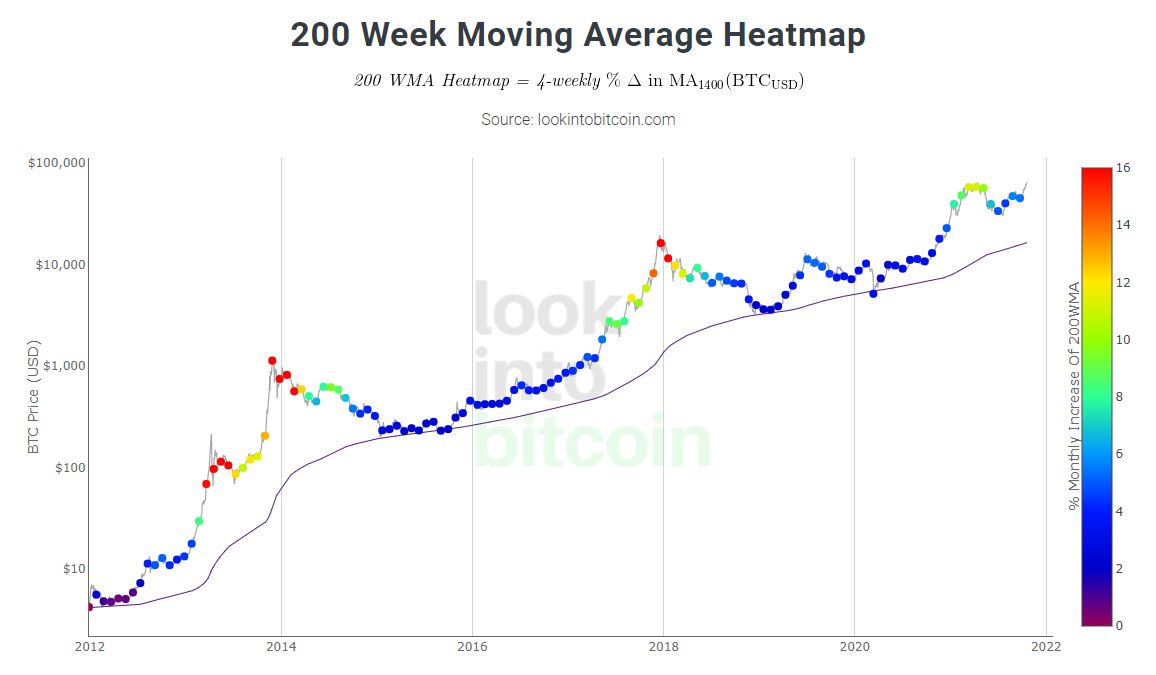
Chart courtesy of lookintobitcoin. The 200-week moving average heatmap gives us long term HODLERs an indication of when a top in the market may occur. Depending on the month-by-month % increase of the 200-week moving average, a colour is assigned to the price chart. The steeper the price increase the “hotter” the heat map becomes. This has worked extremely well in indicating an end of the trend, and interestingly the recent price increase has been relatively steady. The red dots tend to indicate a parabolic rally, or a blow-off top, which is generally how BTC ends a bull market.
This is yet to occur and the heat map is indicating there is potentially more upside yet to come.
BTC – Golden Ratio
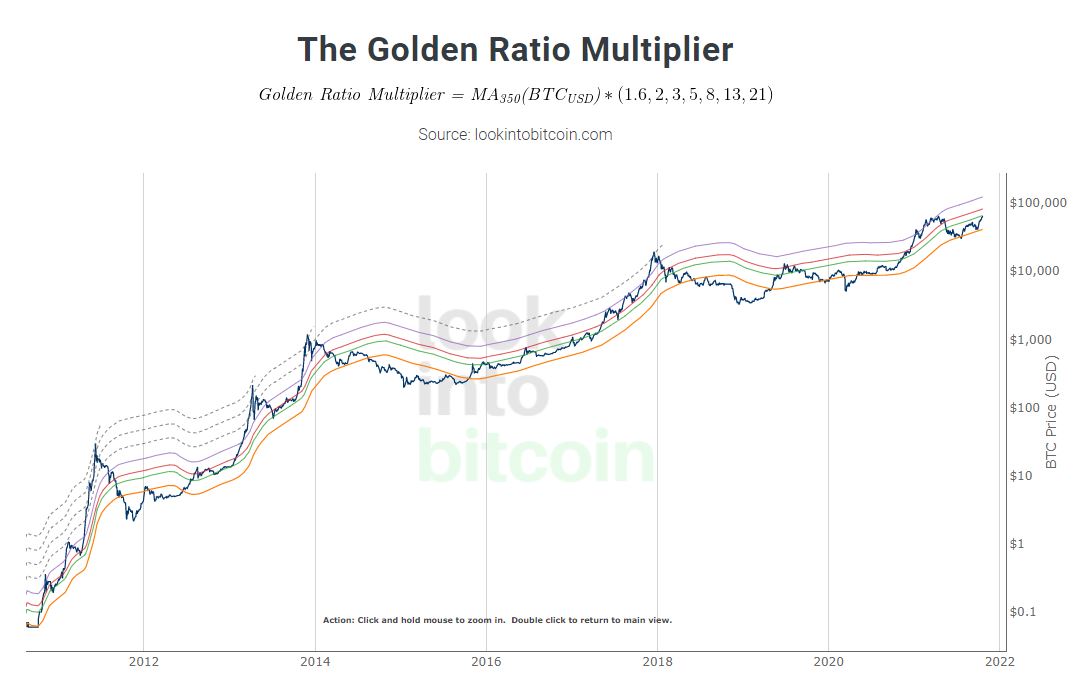
The Golden Ratio Multiplier explores Bitcoin’s adoption curve and market cycles to understand how price may behave on medium to long term time frames. The multiples reference the Golden Ratio (1.6) and the Fibonacci sequence (0, 1, 1, 2, 3, 5, 8, 13, 21). These are important mathematical numbers. Technical traders will be well aware of the importance of Fibonacci ratios as we use them when trading most assets. The outer bounds of the golden ratio multiplier are peaking north of $100,000 USD towards the end of the year.
Just cast your eyes at the date of the end of each bull run. Generally, BTC peaks towards the end of the year with a parabolic rally leading into Christmas. Are we setting up for a similar scenario this year?
BTC – Technical Analysis
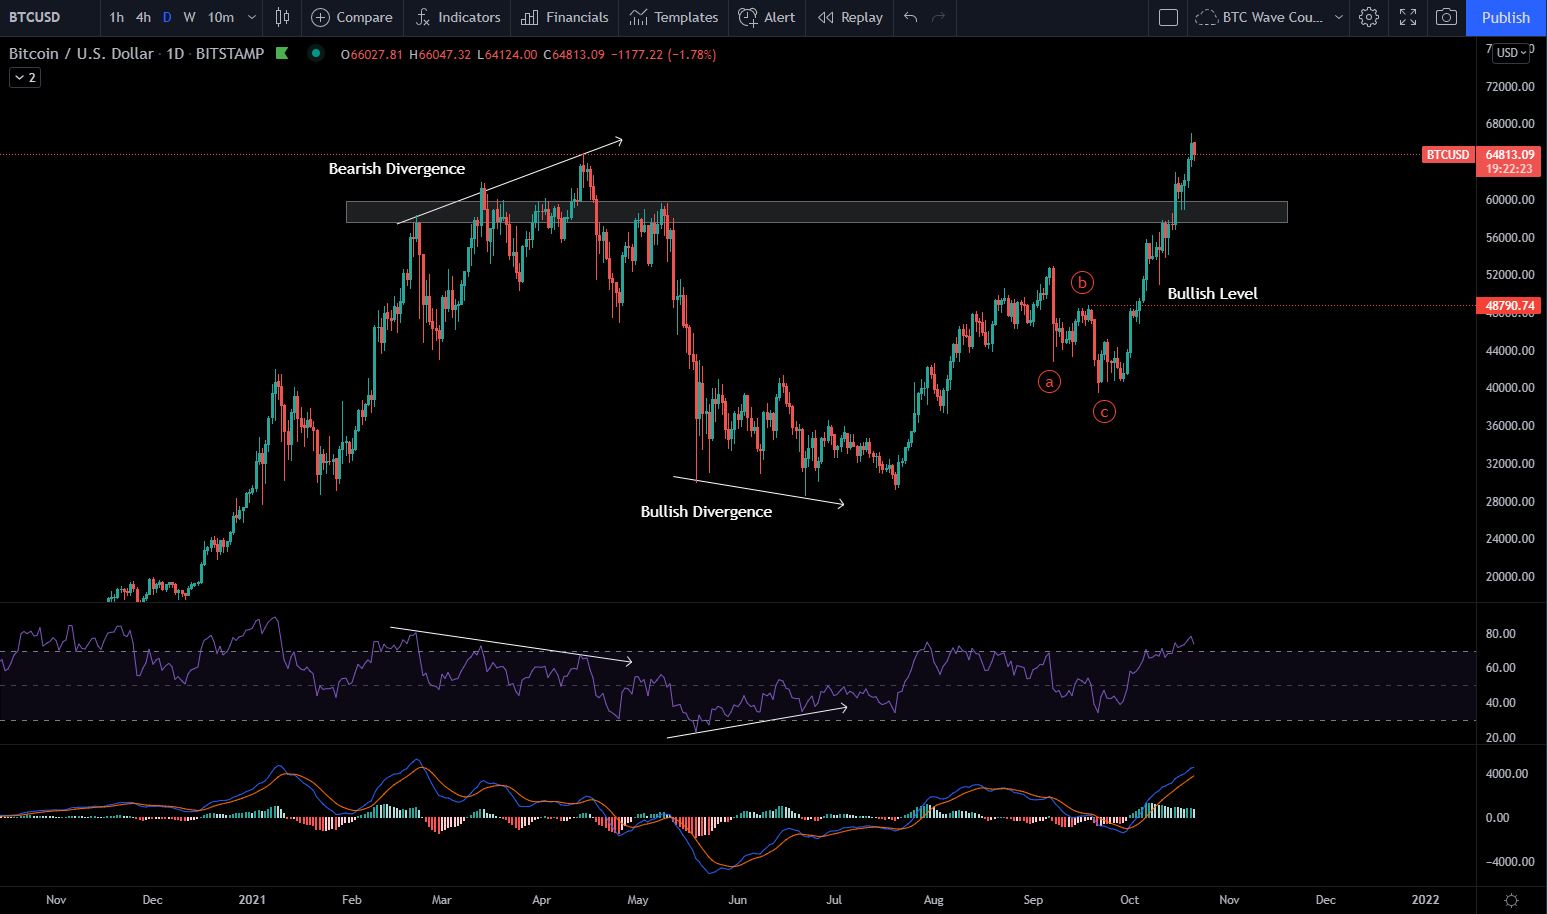
Of course, emotions are high at the moment, and rightly so, however, we need to remain calm and take a look at the technicals from a neutral perspective.
Taking a look across all financial markets, a double top is very rarely the end of a trend. A double top can result in selling pressure coming into the market, which could happen, however it is generally just a pullback. Therefore, even if BTC has a large pullback in the market we can be confident of a continuation to the upside. The previous peak of $65,000 USD had a number of indicators suggesting a reversal, one of them was a bearish divergence on the RSI. The second was a cross over on the MACD. Neither of these has occurred yet, so the technicals favour a continuation. We want to see the $60,000 USD support hold in the short term.
Mining Returns
S19J Pro 100 TH
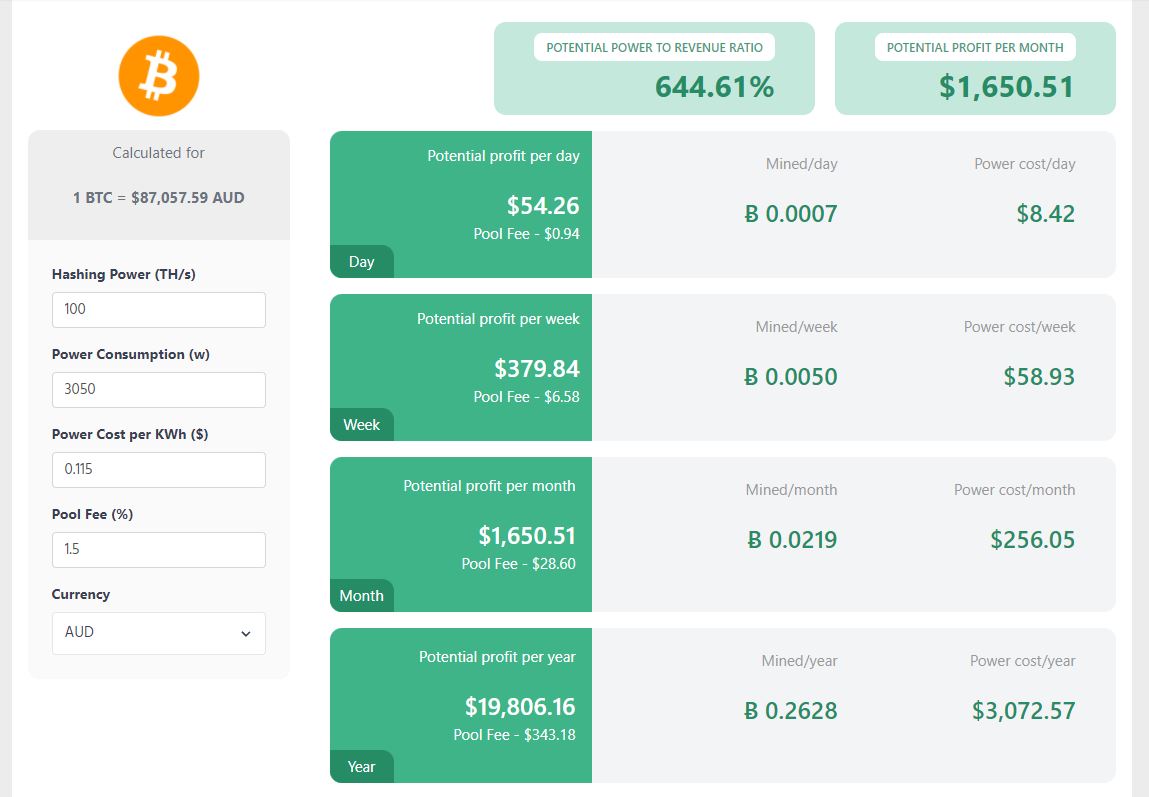
Figures in the above chart are based in AUD and through our hosted solution. The daily return rate in AUD will fluctuate on a day to day basis. However, the S19J is estimated to mine you roughly 0.26 BTC per year. This is our most popular machine due to the decrease in power consumption meaning it is easier on your wallet on a month to month basis.
If you are looking to take advantage of the current market climate I would recommend doing so sooner rather than later. We have been inundated with calls and emails and the team is doing our best to get back to you all as soon as possible.
Conclusion:
As Bitcoin continues to reach new all-time highs, the potential for crypto mining profitability becomes increasingly attractive. The current market environment, bolstered by the success of Bitcoin ETFs, presents an ideal opportunity for both new and experienced miners to explore the benefits of ASIC Mining. With the right strategy and tools, you can capitalize on the growing momentum and secure a strong position in the market.
For those looking to understand how to start mining Bitcoin or optimize their existing operations, Mining Store is here to help. Our 30-minute free consultation provides tailored advice on maximizing your ASIC Mining setup and enhancing your crypto mining profitability. Whether you’re just beginning your journey or seeking to refine your approach, our experts are ready to guide you every step of the way. Don’t wait—book your consultation today and take the first step towards unlocking the full potential of Bitcoin mining.
BOOK A CALL
Until next time,
Kind regards,
Tony Fernandez
Head of Trading
MiningStore