
Crypto Bull Market-ARE YOU READY TO RUN WITH THE BULLS?
In 2017 Bitcoin rose from under 1,000 US dollars to an all time high of about 19,783 US dollars on 17 December, moving through a series of steep, staged rallies. This article breaks down those 2017 stages, shows a 2019 attempt to project the next run, and compares that projection with what actually happened.
Quiet periods are a good time to plan. Looking back at 2017, when Bitcoin ran from under 1,000 US dollars to about 19,783 US dollars at its December peak, the traders who did best were usually those with a plan, not those chasing the top. A common approach is to decide in advance where you would take partial profit and, if you exit early, to re enter only on sound technicals rather than emotion. None of this is financial advice, and past cycles do not guarantee future ones.
Key Takeaways
- Bitcoin reached its 2017 all time high of about 19,783 US dollars on 17 December 2017, having started the year near 1,000 US dollars.
- The 2017 run happened in staged rallies, with the final leg from about 12,000 to nearly 20,000 US dollars taking only a few days.
- In 2019 the author projected a next run mirroring the 2017 percentage gains, ending near a 200,000 US dollar target, clearly a speculative model rather than a forecast.
- Bitcoin later broke 20,000 US dollars in December 2020, peaked near 69,000 in November 2021, and set an all time high near 126,000 US dollars on 6 October 2025.
- As of July 2026 Bitcoin traded near 63,000 US dollars in a bear market, so the 200,000 US dollar target had not been reached.
The under $3K USD bracket
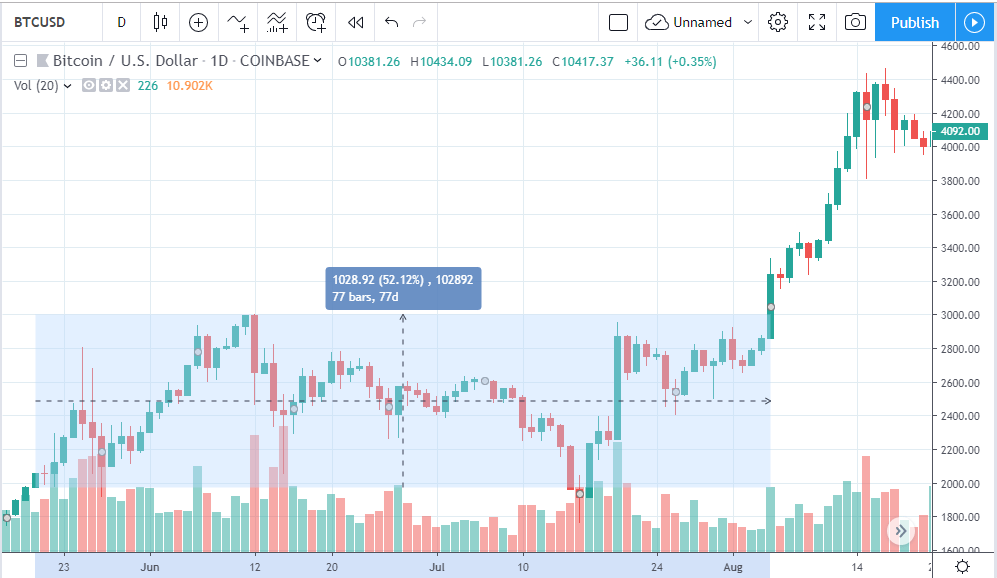
This was before we really broke into the upside. From 21st May to 4th August 2017 Bitcoin stayed in the $1,750 – $3,000 bracket and offered a 50% increase at least twice in that time.
The up to $5K USD bracket
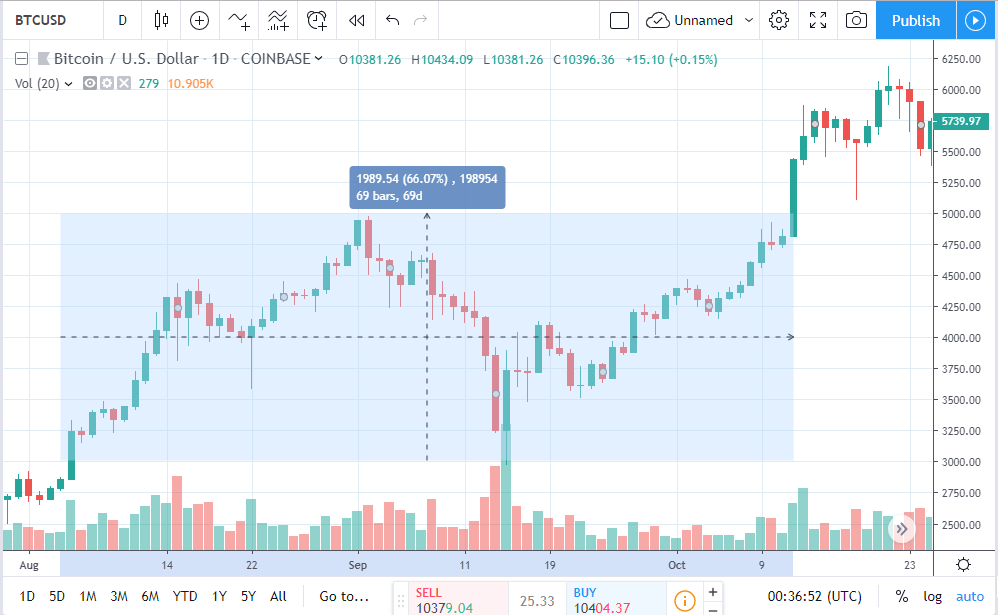
From 5th August to 12th October 2017 Bitcoin broke past $3,000 and spent 69 days in a range up to $5,000 representing a 66% increase. Very large volume appears in the middle of this bracket when Bitcoin perfectly back-tested the previous support of $3,000.
The up to $8.5K USD bracket
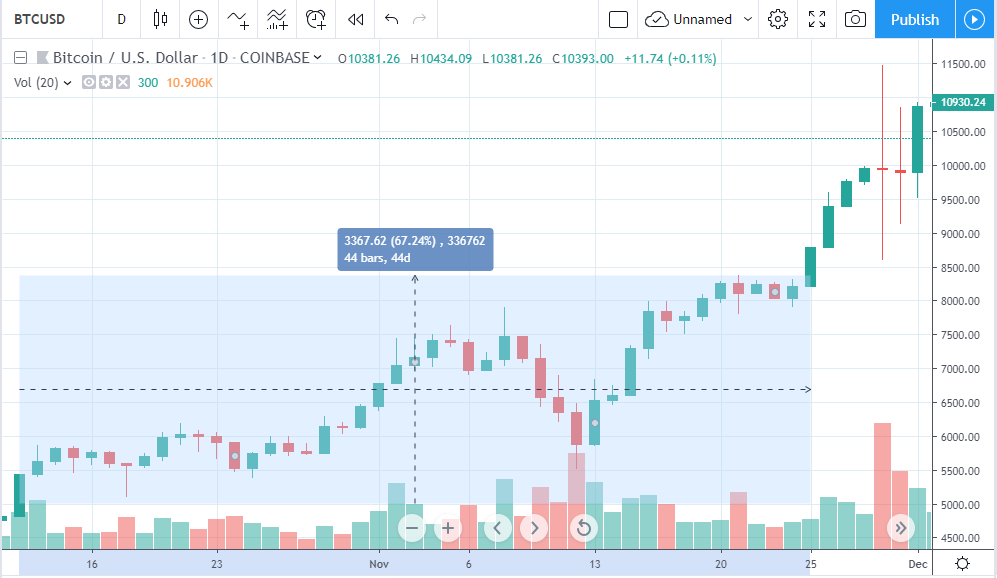
The period $5,000 – $8,500 lasted 44 days between 12th October and 25th November 2017. During this period, 67% price appreciation was presented and you could have traded successfully in this range at least twice.
The up to $12K bracket
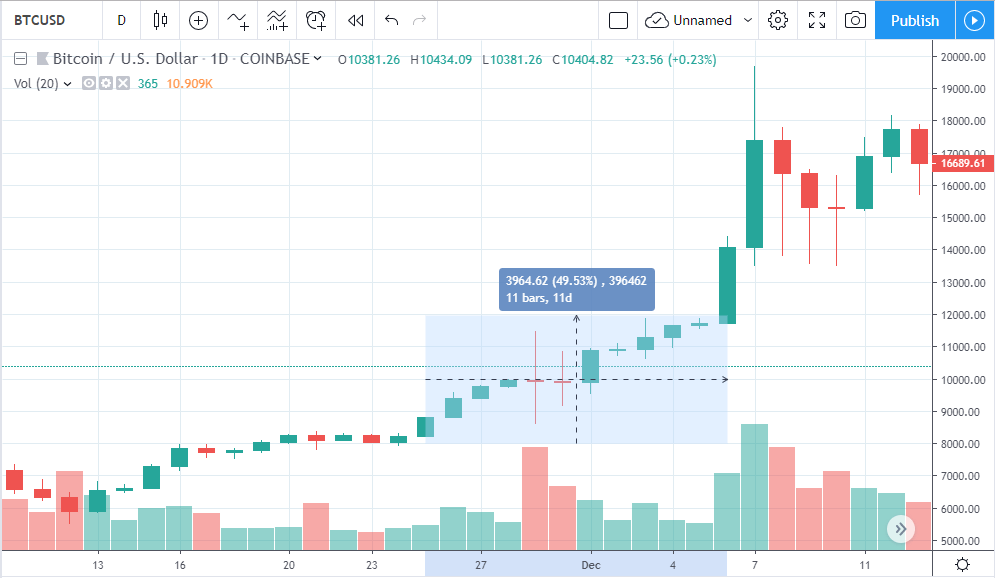
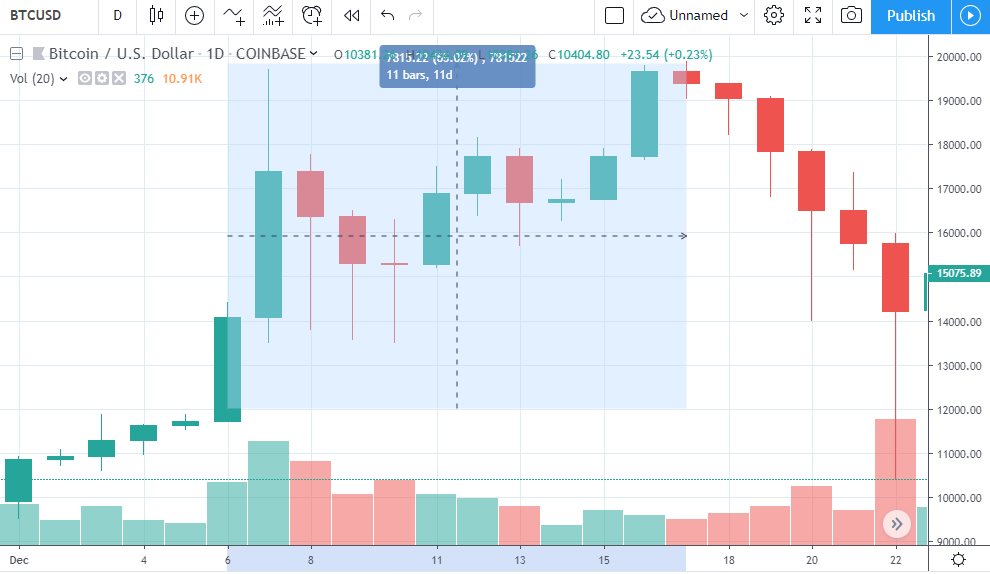
The period between 25th November and 6th December 2017 presented a 50% increase in price and ranged between $8,000 – $12,000. This represented a fairly aggressive appreciation period, especially when you consider it was only 11 days.
The all time high $20K bracket
Between 6th December and 17th December 2017, Bitcoin went from $12,000 to $20,000, appreciating the last $8,000 of that in just three days. This leap demonstrates a 65% increase in price and stayed there for 11 days before beginning its descent.
Summary
If we breakdown the 2017 run by pure numbers, it really was a ridiculously impressive period. There was a heap of hype and stacks of swing trading opportunities. Using these levels, I’ve replicated a potential target for the next run. The general idea is that once the run starts, you want to avoid getting caught up in the moment. You should have set exits and, if you are seasoned, re-entry points.
One way forward would be to use the below stages to sell or trade 50% of your Bitcoin position, or another might be using these as potential partial take-profit levels.
The final level is $200K USD, which at first glace might seem totally insane, which is fair enough and it just might be. But looking at the previous price movement, and the total lack of history for what’s achievable in this next run, the last run gave us massive appreciations in the final three days. If you are going to hold or trade for this entire period you really want to try and capitalise on that last aggressive price appreciation.
Personally, I’ll have a set level within the below targets where I’ll take out about 30% of my position to cover entries. And then I’ll be looking to hold the residual through to what looks to be the end of the run.
Whatever your targets are, write them down, work on them and keep honest by reminding yourself of what they are. Easier said than done, but try and back your own decisions and avoid getting caught up in too much market noise. You really only want to be able to blame yourself.
All that in mind, let me be explicitly clear – this is not financial advice and you should always do your own research.
|
2017 Bull Run |
Upcoming Bull Run |
||||||
| Days | Start | Finish | % Gain | Days | Start | Finish | |
| 77 | $1,750 | $3,000 | 50% | 80 | $20,000 | $30,000 | |
| 69 | $3,000 | $5,000 | 66% | 70 | $30,000 | $49,800 | |
| 44 | $5,000 | $8,500 | 67% | 45 | $49,800 | $83,166 | |
| 11 | $8,500 | $12,000 | 50% | 15 | $83,166 | $124,749 | |
| 3 | $12,000 | $20,000 | 65% | 5 | $124,749 | $205,835 | |
FEAR & GREED
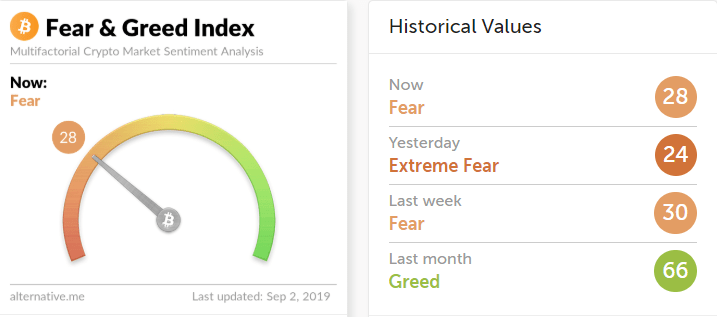
Sentiment tools like the Fear and Greed Index can help you avoid buying into euphoric spikes that often drift back to support. In 2019 the levels being watched were around 10,100, 9,700 and 9,000 US dollars, and those are historical, not current. The general principle still holds: it is usually calmer, and often wiser, to build a position when the market is flat rather than reacting to a sudden jump.
TECHNICAL ANALYSIS
BTC has broken above the 10k USD mark, re entered the triangle pattern, broken the first key Fibonacci resistance and broken the 50MA line! These are all major areas of support for BTC.
It will be interesting to see if BTC now looks to push to the next key Fibonacci resistance at $10900 USD. A break of $10900 USD could have many traders left to dry who were hoping to pick up BTC sub 9k.
This next week should set the precedence for a continuation of a bull run or a major correction.
Conclusion:
Reflecting on 2017 shows how quickly a bull run can move and how easily hype can override a plan. The 2019 projection to 200,000 US dollars was never reached, but Bitcoin did make new highs over the following years, which rewards those who accumulate patiently through the cycle rather than chasing the top.
For Australians who want to accumulate Bitcoin by producing it rather than trading the spikes, crypto mining is one of the most direct routes, and Mining Store Australia is the country’s number one supplier and hosting provider. Mining Store sells the latest ASIC miners, including the Bitmain Antminer S21 range, and lifts crypto mining profit by removing the biggest costs of running hardware at home. Its bitcoin miner hosting at 12 cents AUD per kilowatt hour, run from a dedicated facility by Melbourne based founders William Wright and Callum Cameron, handles setup, power, heat, noise and maintenance for more than 6,000 clients.
To estimate your returns, use the Mining Store profitability calculator and Compound Calculator, or book a free consultation with the team to find the right miner and hosting plan. You can also call 1300 644 978 or email [email protected] to get started.
Author: Julian Carruthers
Not financial or investment advice, always do your own research.